
Worcester Economic Index
COVID-19 virus impacts local economy
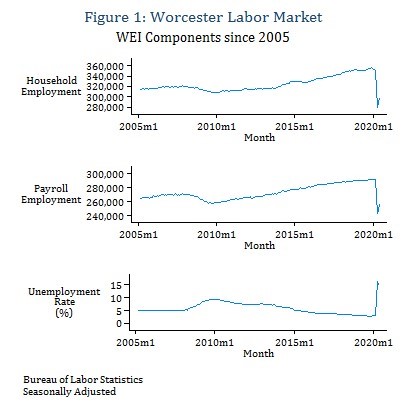 The COVID-19 pandemic has had a dramatic impact on the both the national and local economies. According to the Bureau of Economic Analysis, U.S. GDP decreased at a 32.9% annualized rate in the second quarter of 2020, the largest quarterly drop on record.i Looking at the data from the Bureau of Labor Statistics in figure 1, it is clear the Worcester economy has been similarly affected. Both of the employment measures used to estimate the Worcester Economic Index, household employment and payroll employment, fell substantially in April, much more than the decline during the entire Great Recession of 2008-09. The other component of the WEI, the unemployment rate, increased from 3.1% in March to 14.6% in April, and rose further to 15.8% in June.ii The magnitude of these changes is so far from the norm that the econometric model used to estimate the Worcester Economic Index is no longer appropriate. The model is built on an assumption that changes in economic activity are relatively smooth and while there are fluctuations in the economy, changes occur at varying rates over multiple months. While this assumption is reasonable under normal circumstances, figure 1 shows it is no longer accurate. As a result, estimates of the Worcester Economic Index are not included in this report, but instead a discussion of relevant local economic indicators is provided in its place.
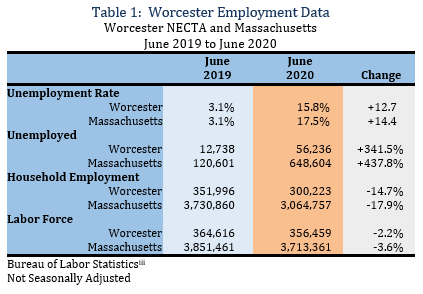
Table 1 shows Worcester and Massachusetts labor market indicators from the BLS Current Population Survey. The unemployment numbers are striking. At over 15%, the unemployment rates are higher than at anytime since the Great Depression. In addition, since June 2019, Worcester and Massachusetts have seen increases in the number of unemployed of 341.5% and 437.8% respectively. So far, the large decreases in household employment have lead to relatively modest reductions in the size of the labor force.
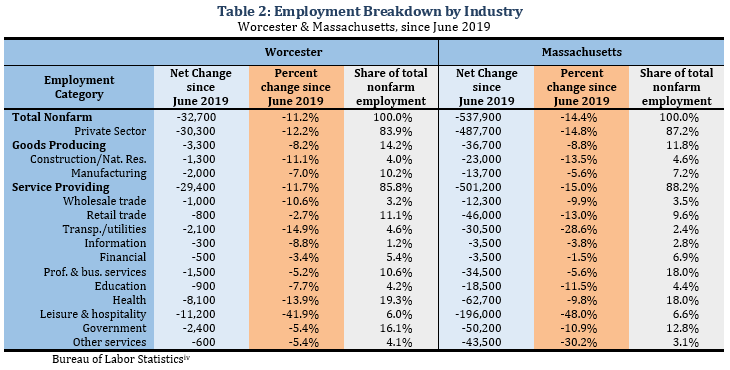
Table 2 presents data from the BLS Current Employment Survey and breaks down changes in employment by industry sector. At both the local and state-wide levels, the service-providing sector has seen a larger relative decline in employment than the goods-producing sector. Not surprisingly, the leisure & hospitality industry has experienced the largest decreases in both relative and absolute terms, in Worcester over 11,000 fewer jobs in that industry compared to a year ago, an almost 42% drop. Notable is the fact that while some industries have been hit harder than others, none have escaped job losses over the past year.
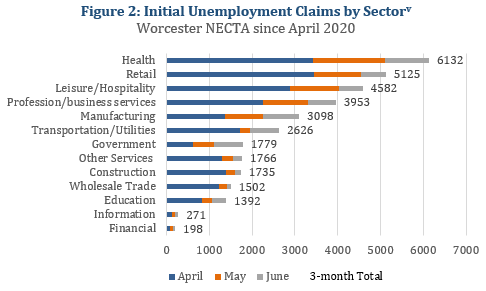
Finally, figure 2 presents data on initial unemployment claims in the Worcester area over the last several months. There was a large number of initial claims in April, following the stay-at-home advisory issued by the Massachusetts Department of Public Health in late March. While the economy has begun to reopen in recent months, there continued to be additional claims filed in May and June. As the figure shows, the sectors that seem to be shedding the most jobs are health, retail, and leisure/hospitality.
There is still a lot that is unknown about the COVID-19 virus and how the economy will recover from the pandemic is also uncertain. Containing the virus is essential for the economy to return to something resembling normal. In addition, economic and public health policy at the federal, state, and local levels will impact economic activity in the coming months.
Additional information about this project is available here.
Prepared by:
Thomas White, Ph.D.
Grenon School of Business – Department of Economics, Finance & International Business
Assumption University
508-767-7556
July 31, 2020
Subscribe to have Worcester Economic Indicators delivered to your inbox each quarter.
i Bureau of Economic Analysis, July 30, 2020. https://www.bea.gov/news/2020/gross-domestic-product-2nd-quarter-2020-advance-estimate-and-annual-update.
ii Author’s calculations based on data from the Bureau of Labor Statistics. The not seasonally adjusted BLS data is adjusted for seasonal variation by the author using the X-12 ARIMA program developed by the U.S. Census Bureau. Household employment, the unemployment rate, and labor force data obtained from the Local Area Unemployment Database (LAU) of the BLS, https://www.bls.gov/lau/data.htm. Payroll employment is obtained from the State and Area Employment Database (SAE) of the BLS, https://www.bls.gov/sae/data/home.htm.
iii Author’s calculations using Massachusetts and Worcester NECTA data obtained from the Local Area Unemployment Database (LAU) of the BLS, https://www.bls.gov/lau/data.htm.
iv Author’s calculations based on data from the Bureau of Labor Statistics. Worcester NECTA and Massachusetts household employment from the State and Area Employment Database (SAE) of the BLS, https://www.bls.gov/sae/data/home.htm.
v Massachusetts Department of Employment Assistance, Labor Market Information. https://lmi.dua.eol.mass.gov/lmi/ClaimsData.